Core Web Vitals
Last updated: August 19, 2026
The Core Web Vitals screen shows how your pages perform against Google's user experience metrics — in real time, from actual users, not web crawlers. Unlike most Core Web Vitals tools, which sample data from automated crawlers, Gamera measures from real sessions across 100% of your users, on all devices, geographies, and browsers. This means you can monitor trends over time with complete coverage — not just snapshots.
This screen gives you two views into page performance: a Scorecard showing your current standing across all five metrics, and a Vitals vs Metrics view for exploring how your CWV scores relate to user behavior. Use it to spot what's hurting performance, understand where problems are concentrated, and track whether your fixes are working.
Quick Wins
New to the Web Vitals screen? These are the highest-impact things you can do right now:
1: Check your Scorecard
Open the Scorecard tab and see which metrics are in amber or red. That's your starting point — everything else follows from what's flagged here.
2: Start firing milestones today
Any time your team deploys a change that touches ads, scripts, or page templates — mark it with a milestone. You don't need to investigate anything first. Milestones just require your engineering team to fire a tag at deployment time, and they immediately make your CWV trend lines interpretable. This is the lowest-effort, highest-value thing you can set up.
3: Add a custom dimension to your next A/B test or rollout
If your team is testing or rolling out any change that could affect page performance, tag the cohorts with a custom dimension. This lets you compare CWV between treated and untreated sessions and confirm whether the change helped or hurt — without waiting for aggregate trends to shift.
4: Filter by device to find where flags are concentrated
If a metric is flagged, split mobile vs. desktop first. CWV issues — especially INP — are often mobile-specific. Knowing this immediately narrows where to focus without any additional setup.
5: Use Vitals vs Metrics to connect performance to business impact
Open the Vitals vs Metrics tab and compare your Performance Score against pageviews or bounce rate. If there's a visible correlation, you have a business case — not just a technical one — for prioritizing CWV improvements with your team.
Metrics Reference
Metric | Description |
CLS | CLS measures visual stability. It is the largest sum of unexpected layout shifts that happen during a user's visit |
LCP | LCP measures loading performance. It is the time it takes for the largest image or text block visible in the viewport to render |
INP | INP measures responsiveness. It reports how long it takes your page to react to user interactions such as clicks, taps, and keypresses |
TTFB | TTFB measures server responsiveness. It is the time between the browser requesting a page and receiving the first byte of the response |
FCP | FCP measures perceived load speed. It is the time from navigation to when the browser renders the first piece of content (text, image, canvas) from the DOM |
Scorecard
The Scorecard tab gives you an at-a-glance view of where your site stands right now. It shows your Performance Score — a Gamera-calculated composite across all five CWV metrics — alongside the current measured value for each individual metric plotted against its threshold range.
Each metric displays a color-coded bar with your current value marked by a pointer. This makes it immediately clear which metrics are healthy, which need attention, and how close to a threshold boundary you are. The Performance Score dial in the top left summarizes the overall picture in a single number.
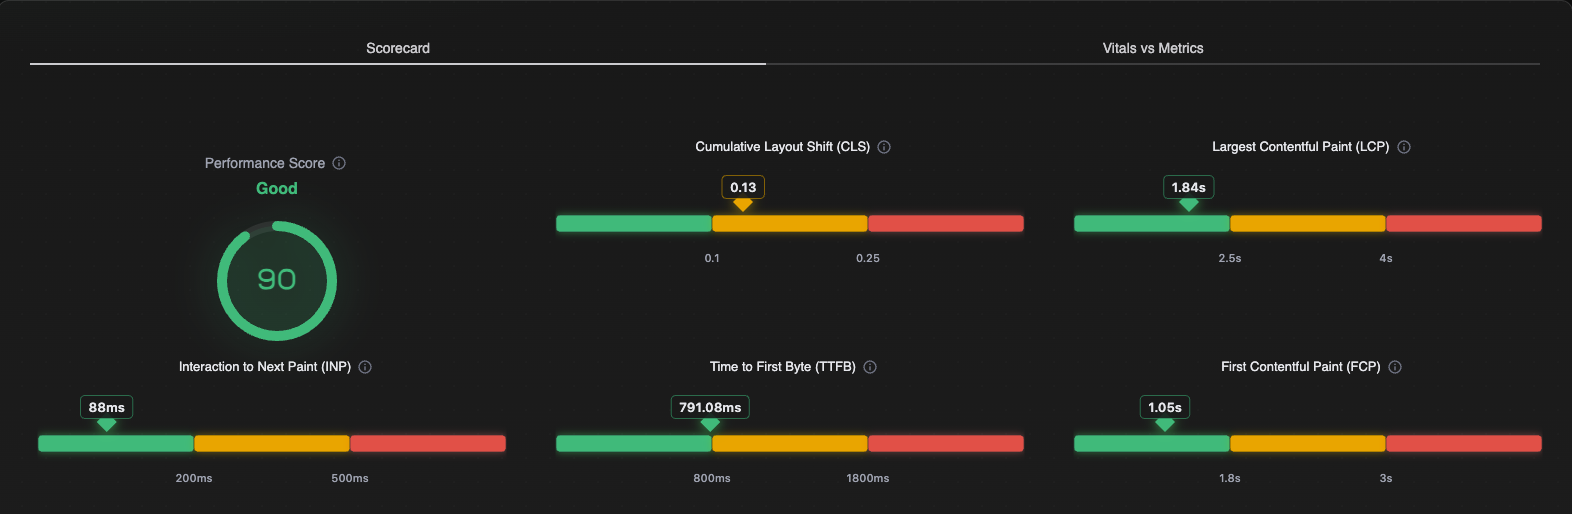
How to read it
Use the Scorecard as your first stop. If all five metrics are in the green, no further investigation is needed. If one or more are in amber or red, move to the Vitals vs Metrics view or the filtering tools to understand where the problem is concentrated.
Vitals vs. Metrics
The Vitals vs Metrics tab lets you explore the relationship between your CWV performance and your user behavior metrics over time. Both lines are plotted on the same chart so you can see whether they move together — and by how much.
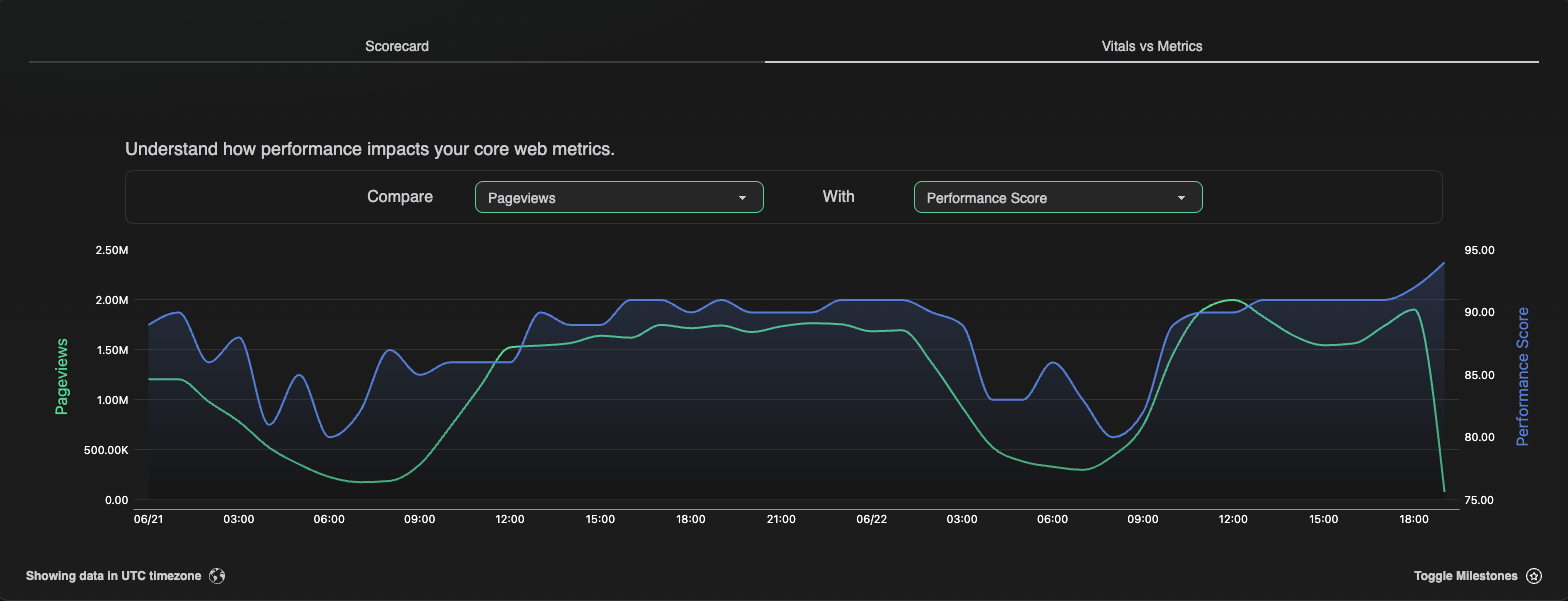
How it works
Use the two dropdowns to choose what to compare:
Compare: A user behavior metric, such as Pageviews, Unique Users, Total Visits, Scroll Depth, Bounce Rate, or Visit Duration. This plots on the left axis.
With: A CWV metric or Performance Score, such as Performance Score, LCP, CLS, INP, TTFB, or FCP. This plots on the right axis.
The chart shows both lines over the selected date range. Any notable correlation — in either direction — is worth investigating. An inverse relationship is often the most telling: for example, if your Performance Score drops as traffic increases, that points to a load or scaling issue. If bounce rate rises as INP worsens, slow page responsiveness is likely driving users away. The goal is to spot patterns between how your site performs and how users behave, so you can act on the right thing.
When to use it
Diagnosing a traffic drop: If pageviews or unique users have fallen, compare them against Performance Score or LCP. A concurrent CWV degradation is a signal that page experience may be contributing to the drop — particularly through Google Search ranking effects.
Understanding bounce rate spikes: Compare bounce rate against INP or LCP. If bounce rate rises at the same time a CWV metric worsens, slow or unresponsive pages are a likely contributor to users leaving without engaging.
Validating that a CWV fix improved engagement: After deploying a fix and marking it with a milestone (see Milestones below), compare scroll depth or visit duration against the relevant CWV metric. If both improve from the milestone point, you have evidence that the fix had a positive effect on user behavior — not just the performance score.
Building an internal business case: Use the chart to illustrate the relationship between performance and user engagement for stakeholders. A clear visual correlation between a poor CWV period and lower pageviews or shorter visit duration can help prioritize engineering time for performance fixes.
Use Milestones
The Toggle Milestones button overlays your milestone markers on this chart. This is especially useful when validating fixes — you can see whether both the CWV metric and the user behavior metric moved in the right direction from the point of your change. See Milestones below for more info.
Investigating Flags
When you see a metric in the Needs Improvement or Poor range, the goal is to narrow down where the problem is concentrated before taking action. The screen gives you several ways to do this.
1: Filter by device
Start by splitting mobile vs. desktop. INP and LCP issues often appear primarily on mobile, where devices have less processing power and are more sensitive to heavy scripts and ad load. If the flag is mobile-only, that significantly narrows what to look at.
2: Filter by page type or section
Break down by URL pattern or content category. CWV issues frequently concentrate on specific page templates — article and news pages with multiple ad slots tend to be the most common hotspots for INP and CLS. If a flag is isolated to one section, it's much easier to act on.
3: Use a custom dimension to isolate a variable
If you suspect a specific ad experience, vendor, or on-page change is causing the issue, you can pass it as a custom dimension. This lets you filter the CWV charts to compare performance between the sessions that had that variable and those that didn't. See Custom Dimensions for more information.
4: Cross-reference with Inventory Quality
High ad density and aggressive refresh intervals often correlate with INP and CLS problems. If you're seeing a flag on article pages, check your impressions-per-minute and ad density figures in the Inventory Quality screen — those numbers give context for what the CWV data is reflecting.
5: Mark your changes with a milestone before you fix anything
Before deploying a fix, fire a milestone so the moment is marked on your CWV graphs. This makes it easy to see whether the metric improved after the change — and by how much. See Milestones for how this works.
If INP or CLS is flagged on article pages, the most effective place to look is ad load behavior — specifically how many ads are loading, when they load relative to page content, and how frequently they refresh.
Custom Dimensions
Dimensions are attributes that describes the context of a user session
A dimension answers the question: what experience did this user receive? It's a label attached to a session — not an action — that lets you group sessions by any variable your team controls, and then compare CWV performance across those groups.
For example: if you're testing whether a particular ad wrapper affects page speed, you can tag sessions with which wrapper they received. Gamera will then let you filter your CWV charts to that variable, so you can see directly whether sessions with wrapper A perform differently than sessions with wrapper B.
When to use a custom dimension
A/B testing an ad experience: Tag each variant (e.g. "experience A" vs. "experience B") so you can compare CWV scores between the two groups and confirm which experience performs better before rolling it out fully.
Isolating a vendor or wrapper: If you suspect a specific demand partner or ad wrapper is causing an INP or LCP flag, tag sessions by which vendor or wrapper they received. Filter to that value to confirm or rule it out.
Testing a configuration change on a traffic split: When rolling out a change incrementally — say, enabling lazy loading on 50% of traffic — tag the two groups so you can compare CWV before committing to a full rollout.
Benchmarking by page template: Tag sessions by content type (article, homepage, gallery, etc.) to see which page templates are consistently underperforming and prioritize optimization work accordingly.
Setup
You can find details on implementing custom dimensions here.
Custom Events
Events are user actions you want to track and measure
An event captures what users actually do. Whereas a dimension describes which experience a user received, an event measures whether they took a meaningful action — a login, a scroll, a click, a subscription. Together, dimensions and events let you connect page performance to user behavior.
The most powerful analysis pattern is pairing a dimension with an event: once you've split users into cohorts by experience, events tell you whether the experience actually changed what they did. For example — if you're testing popup timing (immediate vs. delayed), an event on "login complete" shows you whether one version drives more logins than the other.
When to use a custom event
Measuring conversion across an A/B test: Track a login, subscription, or registration action alongside an experience dimension. See whether the CWV-impacting change also helped or hurt your conversion rate.
Scroll depth by ad density cohort: Track how far users read on pages with different ad densities. If lower density pages show deeper scroll, that's evidence for reducing ad load — tied directly to the CWV data in the same view.
Video engagement by experience: Track video plays or completions alongside an experience dimension to understand whether a page experience change is helping or hurting engagement with specific content types.
Paywall interactions by page template: Track paywall hits alongside a page-template dimension to understand which content types drive the most subscription prompts — and whether CWV on those pages is affecting whether users engage.
Setup
You can find details on implementing custom events here.
Milestones
Milestones are markers on your CWV graphs that flag when something changed
Milestones appear as labeled dots on your Core Web Vitals time-series charts. When you deploy a change — a fix, a configuration update, a new ad experience — firing a milestone marks that moment so you can immediately see whether your metrics improved, stayed flat, or got worse.
Without milestones, it can be hard to connect a shift in your CWV trend to a specific cause. With them, the before/after picture is immediate.
When to fire a milestone
Before a fix goes live: Any time you deploy a change intended to improve CWV — lazy loading, ad slot reduction, script deferral — mark it at the moment of deployment. The graph will show you whether the metric moved in response.
Ad stack or wrapper changes: Switching wrappers, updating Prebid versions, or changing bid adapter configuration can have unexpected CWV side effects. A milestone confirms whether a metric shift coincides with that change.
Adding or removing third-party scripts: Onboarding a new demand partner or removing a vendor affects how much script executes on-page. Mark these moments so INP changes are attributable.
Site or template deployments: Major site rebuilds, CMS updates, or template changes. Use milestones to confirm new deployments haven't introduced a CWV regression.
Start of a traffic split test: If you're rolling out a change to a percentage of traffic, mark when the test began. Combined with a custom dimension on the test cohort, this gives you a precise before/after view for the treated sessions.
You can link Milestones to your release tracking tools (GitHub, JIRA, or similar) to automatically flag every release
Timing matters
Fire milestones at deployment time, not after the fact. Milestones mark the moment they're fired — if you deploy a change and forget to fire one, you'll lose the clean before/after point on your graph.
Setup
You can find details on implementing Milestones here.
Putting It Together (Use Cases)
Dimensions, events, and milestones are most useful in combination. Here are a few workflows that show how they work together for common CWV investigations.
Identifying which vendor is causing an INP flag: Tag sessions by demand partner using a dimension. Filter the INP chart to each vendor to see which one correlates with poor scores. Fire a milestone when you remove or defer that vendor's script, then monitor whether INP improves.
Validating a lazy loading rollout: Tag the treatment group with a dimension. Fire a milestone at the start of the test. Compare INP and CLS between the lazy-load and non-lazy-load cohorts before expanding to full traffic.
Measuring whether a UX change helps both CWV and conversions: Use an experience dimension for the test variant. Fire events for key user actions (login, subscription). Confirm that the change improves CWV without harming conversion — or find the tradeoff point.
Shared audit trail across product and ad ops: Use milestones as a team-wide record of changes. Every deployment that touches ad serving, page templates, or third-party scripts gets a milestone, so any CWV shift is immediately attributable — no matter who made the change.