Site Analytics
Last updated: August 19, 2026
Site Analytics gives you a real-time view of how visitors find, move through, and engage with your site — traffic volume, referral sources, geography, device mix, and on-page behavior, all in one screen.
Overview
Site Analytics is built on the same session data Gamera already collects for ad performance — so your traffic numbers and your revenue numbers live in the same data layer, rather than in two tools you have to reconcile by hand.
The page is site-level by default, reflecting everything happening on the domain rather than just ad-exposed pageviews. That makes it a useful shared home base — editorial can use it to see what's resonating, product can track engagement alongside performance, and revenue teams can pull the same numbers when a traffic shift needs to be connected back to yield.
Because Site Analytics runs on the same tag as the rest of the Gamera platform, it's also where custom dimensions you've already set up will surface — no separate configuration needed.
Summary Metrics
The top of the page surfaces six headline metrics for the selected date range, each with a percentage change against the prior comparable period.
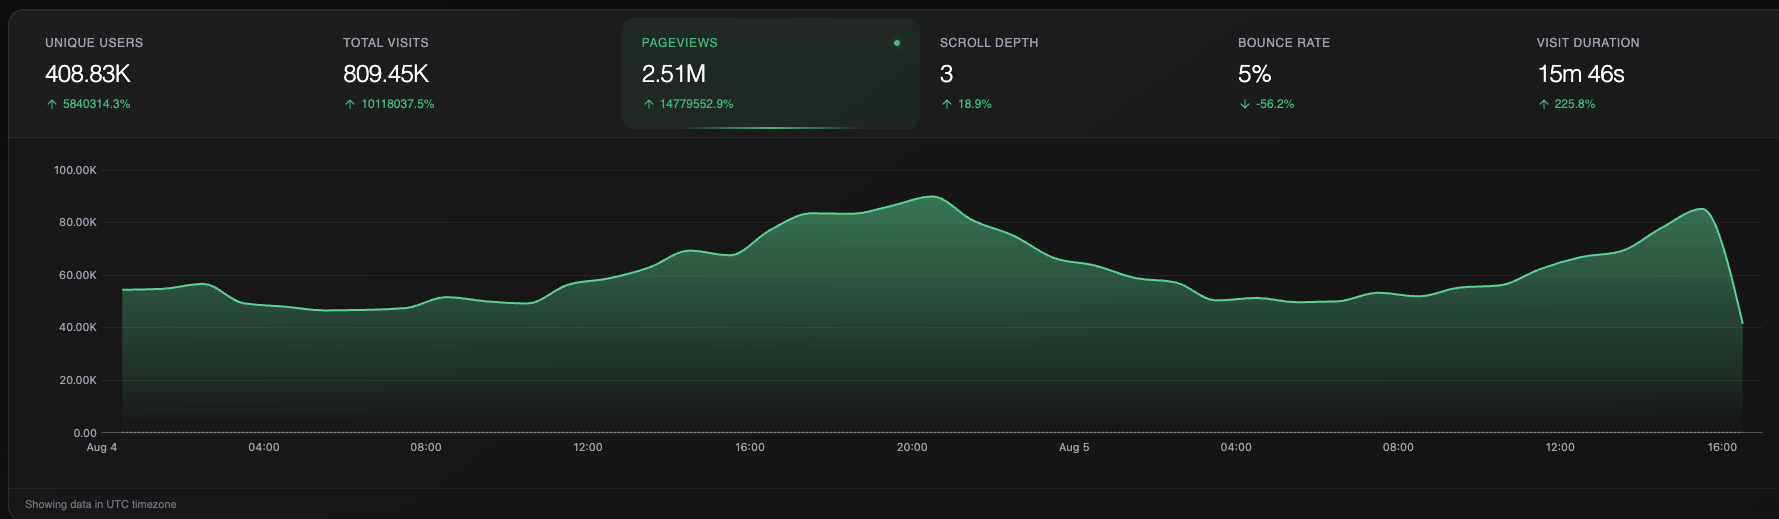
Unique Users: distinct visitors to the site in the selected date range.
Total Visits: the number of sessions across all visitors — one user can have multiple visits.
Pageviews: total pages loaded across all visits. This is the metric plotted on the trend chart by default.
Scroll Depth: the average number of viewport heights users scrolled down the page. It's a raw multiple of viewport height, so the actual distance in pixels it corresponds to will vary by device (since mobile viewports are shorter, mobile scroll-depth values tend to run higher than desktop for similar content length).
Bounce Rate: share of visits where the user left after viewing a single page with no further interaction.
Visit Duration: average time spent per visit, from first pageview to last recorded activity.
Trend Chart
The chart plots your selected metric (Pageviews, by default — click any summary card to switch the chart to that metric) hour by hour across the date range. The dotted line shows the prior comparable period for reference, so you can see at a glance whether a spike or dip is a real shift or a normal daily pattern repeating.
Data is shown in UTC — worth keeping in mind if you're correlating a traffic spike with a specific publish time in your CMS or a scheduled placement change.
Sources & Users
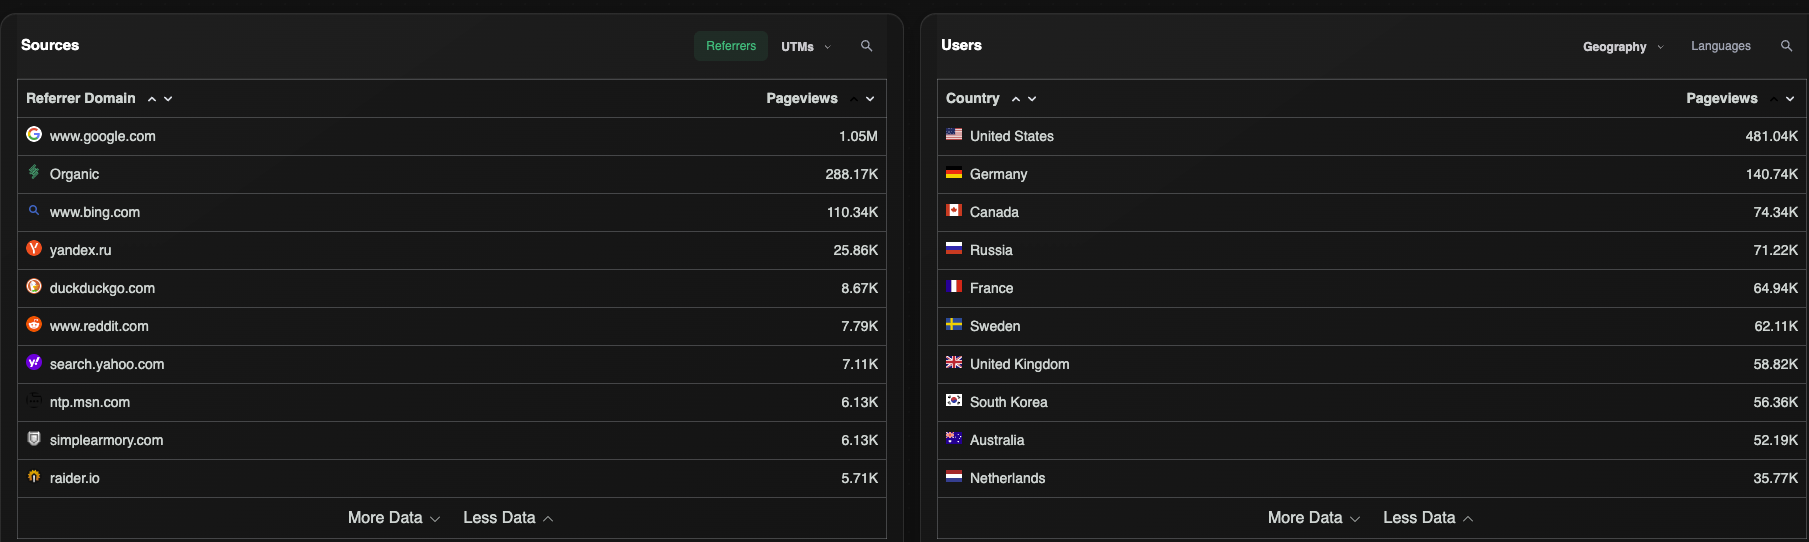
Below the chart, the Sources panel breaks down where traffic is coming from, and the Users panel breaks it down by where visitors are located.
Sources
Toggle between Referrers (the domain a visitor arrived from) and UTMs (campaign parameters you've tagged links with)
Under UTMs, break the data down further by UTM Source, UTM Campaign, UTM Medium, UTM Term, or UTM Content
Organic groups traffic with no referrer or UTM data — typically direct visits or search traffic that doesn't pass a referrer
Users
Toggle between Geography and Languages (browser language setting)
Under Geography, break the data down by Countries, Cities, DMA, Regions, Timezones, or Zip Codes
Ranked by pageviews, so you can quickly see which markets are driving the most engagement, not just the most visits
Pages & Devices
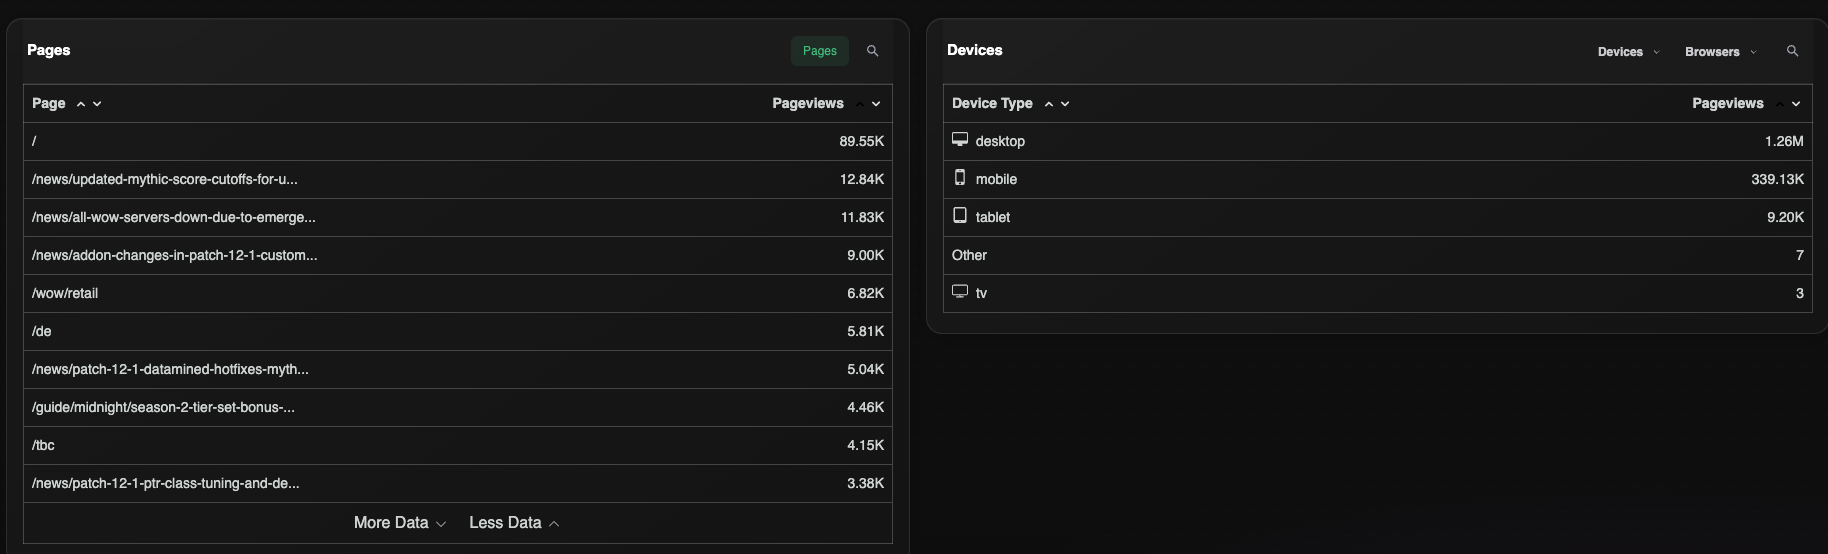
Further down, the Pages panel shows your top-performing URLs, and the Devices panel breaks traffic down by hardware and browser.
Pages
Ranked list of URL paths by pageviews for the selected range
Useful for spotting which articles or sections are driving the traffic behind a spike on the trend chart
Devices
Toggle between Devices and Browsers
Under Devices, break the data down by Device Types (desktop, mobile, tablet, TV), Operating Systems, or Viewport Size
Helpful context when cross-referencing with Web Vitals — a device mix shift can explain a Core Web Vitals change even when nothing on the page itself has changed
Custom Dimensions
If you're already passing custom dimensions into the Gamera tag — for an A/B test, an ad experience rollout, or a content attribute like author or layout — those dimensions show up as filterable columns in Site Analytics automatically, right alongside the built-in Pages, Sources, and Devices panels.
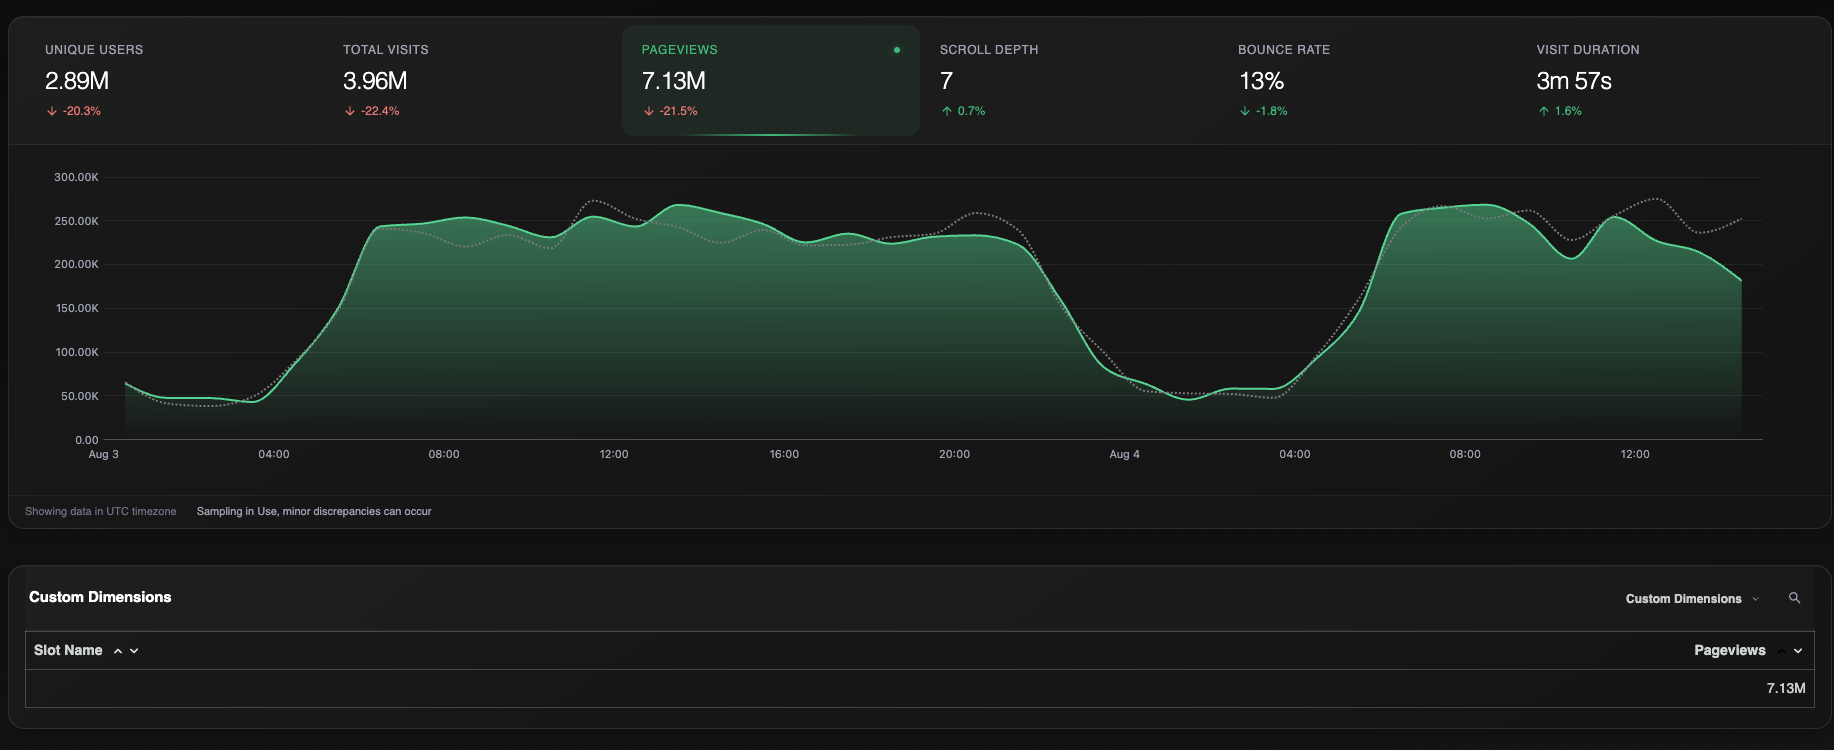
This means you can answer traffic and engagement questions using the exact same dimensions you've already set up elsewhere in the platform — for example, comparing pageviews or scroll depth across the two arms of a wrapper experiment, without needing a separate analytics implementation.
Custom dimensions are defined once at the tag level and apply platform-wide. If you haven't set any up yet, or want a refresher on how they're structured, see the Custom Dimensions section of the Web Vitals guide for the full breakdown of dimensions vs. events.
Filters & Date Range
In the top right of the page, you can:
Control | What it does |
Site toggle | Switch between viewing a single site or all sites on your account combined. |
Filters | Narrow the entire page — chart, panels, and metrics — down to a specific segment. |
Date range | Set the window the page reflects; all percentage changes compare against the equivalent prior period. |
Export | Download the current view's data. |
Share | Generate a shareable link to the current view and filter state. |
Differences between Gamera's Site Analytics and Google Analytics
You may notice discrepancies between some metrics in Gamera's Site Analytics and Google's GA4. These are to be expected and are due to differences in how these metrics are calculated in the two platforms.
Metric | Gamera's Definition | Google Analytics Definition |
Session/Visit Duration | All time spent on page (i.e., includes users who switch tabs and come back) | Only engaged time spent on page |
Bounce Rate | Bounce pageviews, where time on page is <10 seconds | Derived from non-engaged sessions; a session is considered a non-bounce if it lasts longer than 10 seconds, has 2+ pageviews, or includes a conversion event. |
Further mismatches may be due to differences in configuration, and worth checking the items on this list:
Are timezones aligned? The Gamera UI is in UTC
Is the Gamera tag configured to wait for consent (i.e. including the
wait=1parameter) in the GDPR region, and/or is your PV tracker CMP constrained in the same the way Gamera is?Is there a difference in how the system you’re using for PV tracking is loaded to the page vs. Gamera?
Do you have any customizations to how you are counting pageviews - for example, firing a custom event during infinite scroll pages or manually incrementing pageviews in any way?
Does Gamera load with your ad script bundle, or is it hardcoded on the page? If the former, there may be scenarios where Gamera isn't loaded, such as ad blocked sessions or non-monetizable pageviews